Instant presentations and live-data reporting
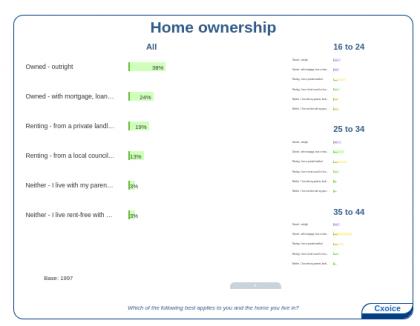
Deliver instant, live-data presentations of your survey with automated live-data charts, that can be drilled down into and exported to Excel or Powerpoint for rapid turnaround of results.
Cxoice is a full end-to-end platform and includes fully-customisable automated analysis, presentations and dashboards.
Automatic presentations and dashboards
 Advanced reporting, presentation and results dissemination capabilities
- Instant report generator for tabulations, charts and dashboards
- Report editor for full control on report design and output
- Live-data dashboards with dynamic filters for custom views
- Live-data full presentations including audio commentary capabilities
- Instant data Tabulations creation and editor with significance testing
- Automatically generate Powerpoint or Excel output
- Feedback on feedback for voting, data-sharing and expectation testing
- Reports that can be run on different data extracts for interims
Monitoring and data quality management
- Management and reporting integration
- Survey monitor with live survey status and live frequency counts
- Data export at any time to Excel or spreadsheets
- Full CATI appointment manager for interviewing teams with sample blocks, sample allocation and quota control
- CATI interviewer time and completion manager
- Sample upload and outcome manager
- Full data extract editor while maintaining source data integrity