Building Reports
In Cxoice, reports consist of two elements. The Report definition itself – which is very like a questionnaire definition, and the data itself which is generated by creating ‘data extracts’ for the survey. A data extract can be taken at any time, so you can generate interim and final reports, but also reports with different filters for particular subgroups.
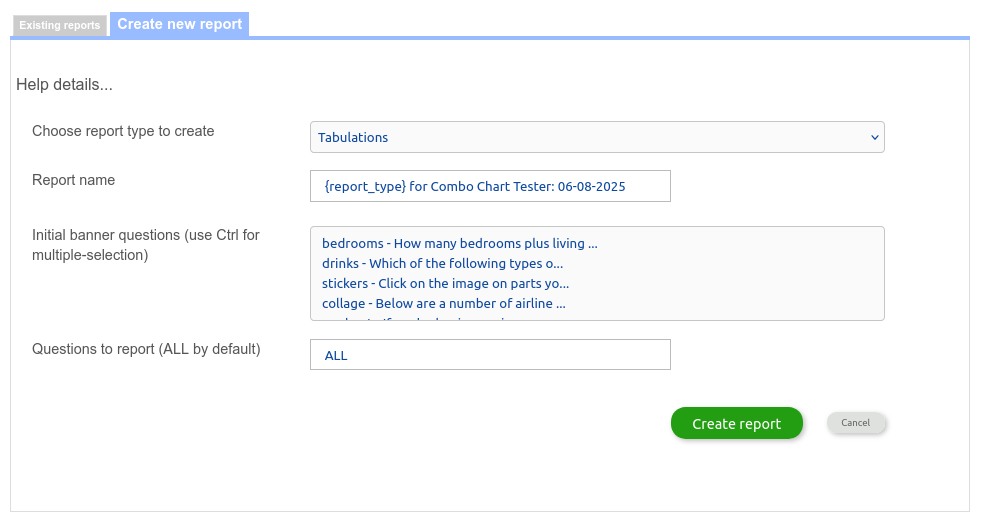
The initial Report definition is normally created automatically from the questionnaire and can be done instantly to build tabulations, charts, slides or a dashboard. Simply take the default options for Create new Report, and click “Create Report”.

Report type
Reports can be tabulations, charting, presentation or a dashboard.
In tabulations the report shows counts and percentages for the questions for the total sample and for selected subgroups (known as the break) in a table format.
For charts, individual questions can be be charted, including subgroups for comparison if required.
A presentation is a set of charts in a slide-by-slide format. Initially, Cxoice automatically creates the charts according to the normal Cxoice house style using the different question types to determine what the data is and how to display it. These include wordclouds for open-ended questions and map-charts for more advanced question types like stickers or collaging.
Report name
The report name can be generated automatically. For instance:
{report_type} for My Survey 04-06-2024
Here {report_type} will be substituted with Tabs, Presentation etc (so the report would actually be ‘Tabs for My Survey 04-06-2024).
You can also create your own title for the report
Initial banner
A ‘banner’ is used to describe the cross-break (or just break) that runs across the top of a set of tables, with each column giving the results for different subgroups. For instance, a banner might include gender, age, and region to allow for data comparisons for the different groups.
In Cxoice banners can be used for both tabulations and presentations.
For presentations, Cxoice shows the charts for each subgroup on the right of the page allowing easy visual comparisons between groups. For presentations, we recommend keeping to one banner question.
Choose the questions that you want included in the banner initially by selecting the questions from the list, using the Control (Ctrl) key when selecting in order to make multiple selections.
For speed, the options are pre-existing questions in the questionnaire. You can create custom banner variables and edit the banner later by using the Report Editor.
Questions to report
By default Cxoice will generate a report for all questions in the questionnaire (excluding script and control variables) with the value ALL.
To select a subset of questions type in the question names in a comma-separated list. For instance q1, q2, q5, q10
The list of questions can be extended, and questions removed or deleted within the Report Editor later.