The cloned question for reports
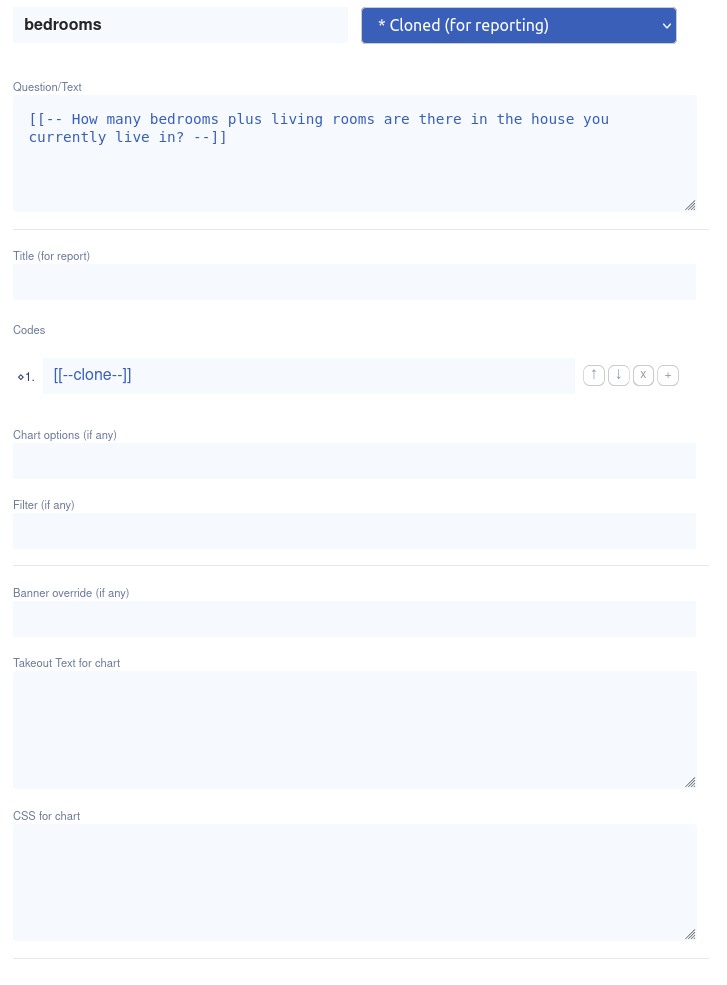
For reporting the initial variable definition for the report is done as a ‘Cloned (for reporting)’ question type. The report generator will automatically create these ‘Clone’ variables.
With a clone question, it pulls the existing question definition from the questionnaire and uses this definition to specify the output for the report.
Clone brings in the relevant question type, so singles are reported as singles, multiples as multiples, grids as grid etc, and also brings in the question and code text automatically.
You can, however, edit the Cloned variable.

The question text shows the question text from the original variable (enclosed by – – to show it is the original content. You can edit or shorten this if you require.
For the codes, these are give as --clone-- which brings in the original codes used. If you want to edit this you can create custom code text for reporting so long as it matches the code value (ie 1, 2, 3 etc) per item.
Chart options, Filter, Banner override, Takeout text and CSS for chart are all standard extensions for a reporting variable.
Filter
In particular you can add a filter if the question was only answered by a subset of respondents (eg _age=4 OR _age=5) and this filter will be applied to the bases for the chart and tabulations.
Takeout text
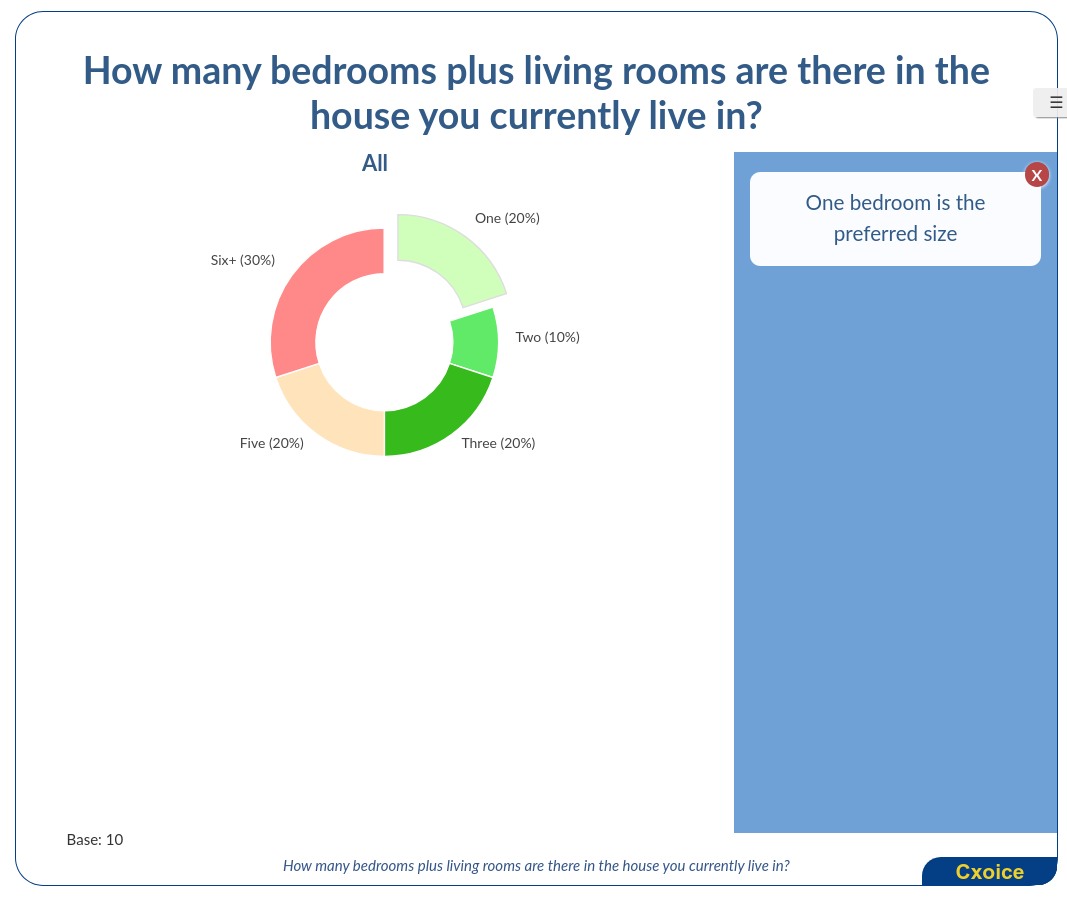
Also heavily used is ‘Takeout text’ – this allows you to write commentary for the chart that will be shown on the chart as an overlay.
The Takeout text can be shown in different formats, but below is an example of a right-hand bar. The takeout text can be ‘closed’ to reveal the whole chart by clicking the close button.
