Automated analysis, tabs, charts and presentations
Cxoice Insight Platform provides live frequency counts so you can monitor survey responses in real time to ensure the data is meeting expectations. One fieldwork is complete, Cxoice provides automated reporting for instant data tabulations direct from the survey. Define the key subgroups in the main banner/cross-break and everything else generated automatically tables, charts and presentations.
 Automated data analysis...
Fast fieldwork also requires fast data analysis, and with Cxoice Survey Systems, tabulations (tabs) and charting are available at a touch of a button, without the need for DP (data processing) specialists.
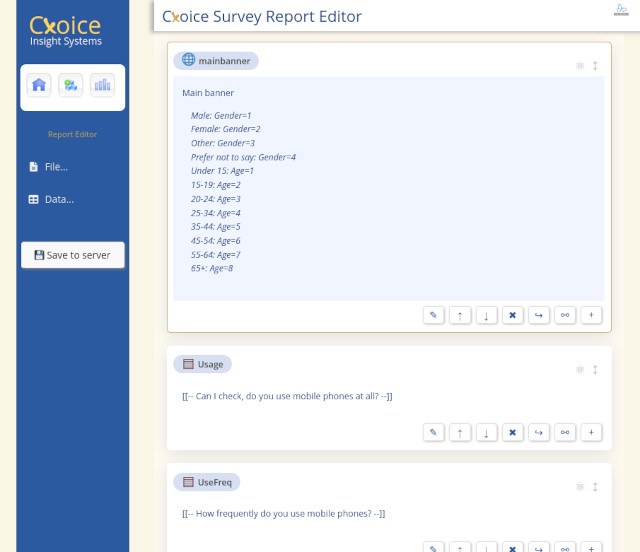
Cxoice automatically creates an initial Reports file generated straight from the questionnaire automatically, so no need for re-keying or importing definitions. For quick tabs and quick charts, all that is needed is to specify the main banner, create a data extract, and click go and tabs instantly appear or can be downloaded to Excel, while charts can be viewed online, published as .pdf or exported in Powerpoint format.
...that becomes bespoke data analysis
However, a good analyst often wants a little more than just the standard output, so the Reports file is easily modified and editing using our Report Editor allowing for more complex analysis such as the addition of summary lines, combination tables and more complex forms of analysis.
Cxoice allows for multiple Report filess to be created so you can build different outputs for different audiences. And once a Reports File has been edited, it is just one click to get the tabs or charts. Reports files can be created at any time, meaning it can be created while fieldwork is going on, so that even with complex analysis, the data can be available immediately after the survey closes, or at a mid-way point. You don't have to wait for fieldwork to end before data processing can start.
Reports and Data extracts can also be run against global filters, allowing for instant individual reports for different departments or regions based on the data collected. And extracts can be pooled across surveys making it easy to build multi-wave analysis for long-term or continuous market studies.
For cleaning and coding, advanced users can add use the Data Editor to create edit files that are applied to the original data without every changing the base data directly, ensuring a full audit trail for each and every record and answer. For projects that involve formal data monitoring and queries/verification, such as clinical research studies, where data is verified for accuracy by a monitor, all stages of the data chain are recorded and maintained to ensure full data integrity. This means that data pre- and post- editing can be tabulated and compared for full data quality assurance.
... and live-data reporting
Cxoice also generates presentation-ready charts and full-scale C-suite quality presentations with live-data, allowing for on-the-fly drill-downs and data exploration, together with text, image and explanation slides to tell and highlight the story in the data.
This allows the finding to be shown directly, while also having direct drill-down access linked to the data to pick up specific queries and data validation, for example to integrate a word cloud, or see specific results for a particular subgroup of your target audience.
The permission-controlled access to Cxoice project areas also allows for access control for sharing data and results with a wider audience, allowing region-specific data to be shared with region-specific teams without needing to share the whole dataset, or complex recutting of charts for different audiences.
The charts Cxoice creates can be exported directly to Powerpoint one-by-one or as a complete set, or used to create print-ready .pdfs for static level presentations where live-data links are not needed.